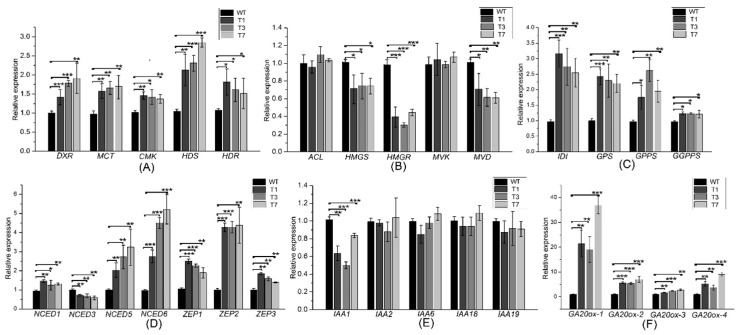
Figure 5.
Expression levels of MEP- MVA-, ABA-, IAA-, and GA-related and downstream genes in the transgenic and WT poplar leaves. (A) Expression levels of DXR, MCT, CMK, HDS, and HDR. (B) Expression levels of ACL, HMGS, HMGR, MVK, and MVD. (C) Transcript levels of IDI, GPS, GPPS, and GGPPS. (D) Expression levels of NCED1, NCED3, NCED5, NCED6, ZEP1, ZEP2, and ZEP3. (E) Expression levels of IAA1, IAA2, IAA6, IAA18, and IAA19. (F) Expression levels of GA20OX-1, GA20OX-2, GA20OX-3, and GA20OX-4. All experiments have been normalized using β-actin as an internal reference; bars represent means ± SD (n = 3). Three independent experiments were performed. The asterisks represent significant differences relative to WT plants (Student’s t-test; *, **, and ***, p < 0.05, p < 0.01, and p < 0.001, respectively).

