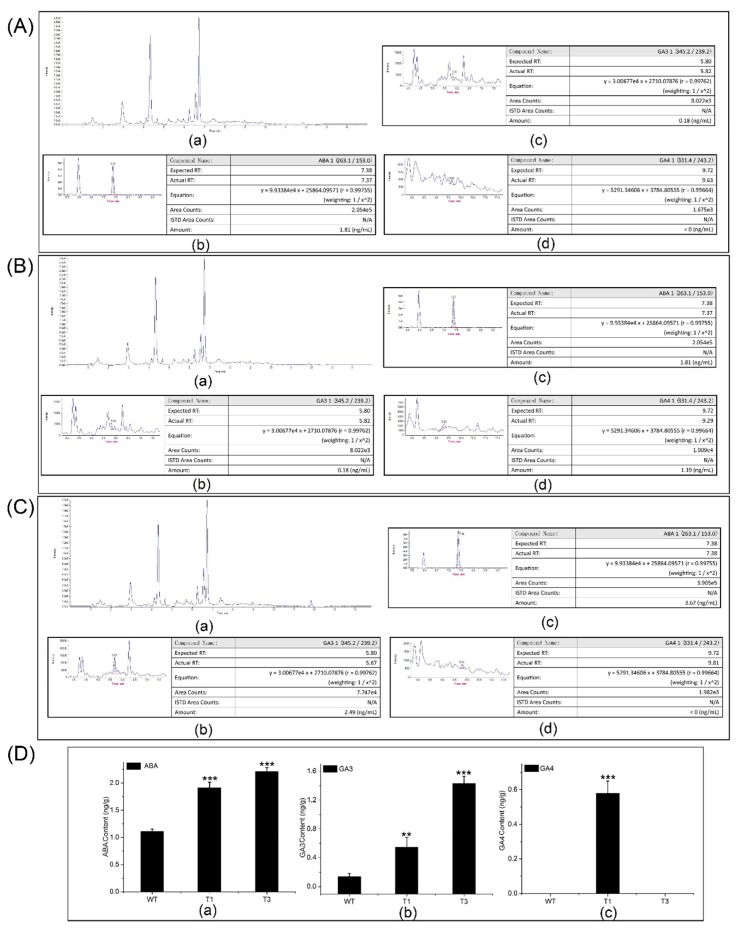
Figure 6.
ABA, GA3, and GA4 contents in the transgenic and WT plants by HPLC-MS/MS. (A) Raw data and ABA, GA3, and GA4 contents of WT plants. (B) Raw data and ABA, GA3, and GA4 contents of T1 plants. (C) Raw data and ABA, GA3, and GA4 contents of T3 plants. (D) Comparison of the ABA, GA3, and GA4 contents of transgenic and WT plants. Asterisks represent significant differences relative to WT poplars (Student’s t-test; **, and ***, p < 0.01, and p < 0.001, respectively).

