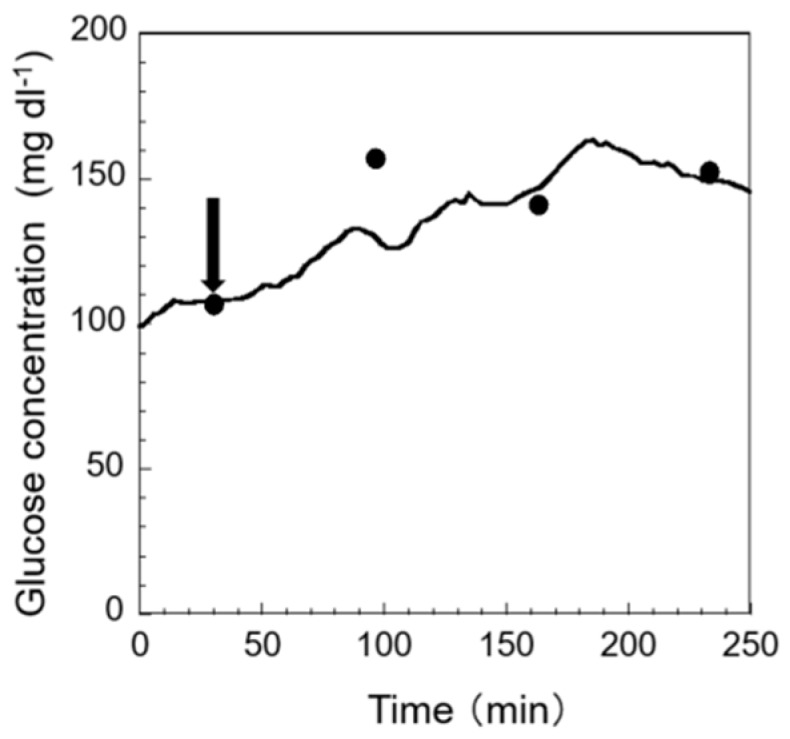
Figure 7.

Monitoring stress response to ammonia addition. Glucose concentrations in the blood, plotted as the first black circles, were used for the one-point calibration method. All other black circles indicate the blood glucose concentration that is described in Section 2.6.2. The arrow marks the time at which the ammonia concentration changed from 0.25 mg L−1 to 10 mg L−1.
