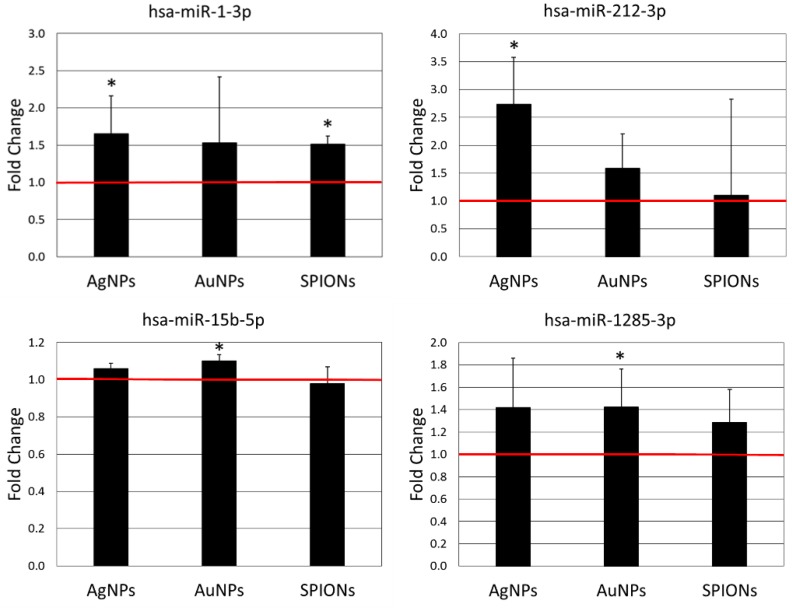
Figure 3.
Expression of miRNAs up-regulated by AgNPs (10 µg/mL), AuNPs (10 µg/mL) or SPIONs (5 µg/mL) treatment for 6 h. Data are expressed as the mean ± standard deviation from three independent experiments. The red line shows the expression level in the control group. Asterisks denote a statistically significant difference versus the control group.

