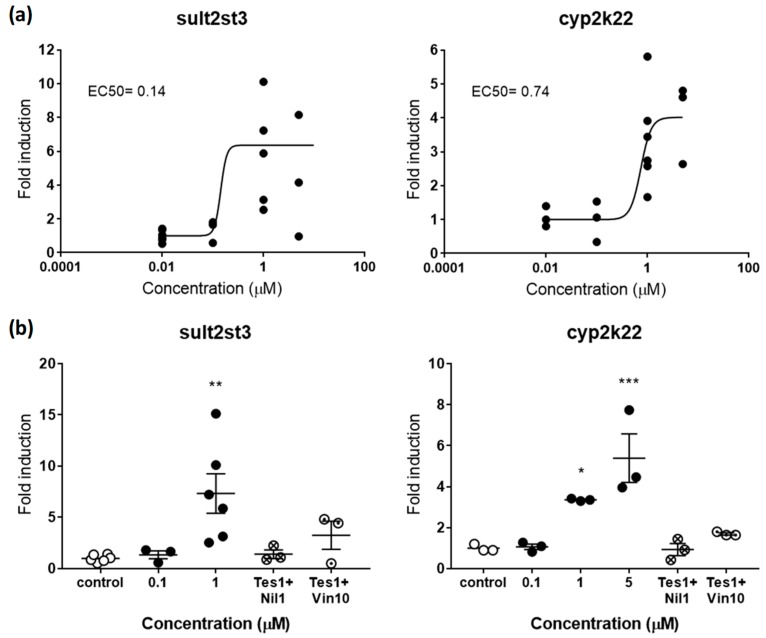
Figure 3.
(a) Dose-response curve for sult2st3 (left panel) and cyp2k22 (right panel) in zebrafish embryos exposed to TES from 48–120 hpf. EC50s in µM are shown for both genes. (b) Rescue effects of the antagonists NIL (1 µM) and VIN (10 µM) on sult2st3 (left panel) and cyp2k22 (right panel) after co-exposure with TES (1 µM). Each data point indicates a biological replicate. The mean ± SE is shown for each treatment. Results were significant when * p < 0.05, ** p < 0.01, *** p < 0.001. 001 (one-way ANOVA plus Dunnett’s multiple comparison test).

