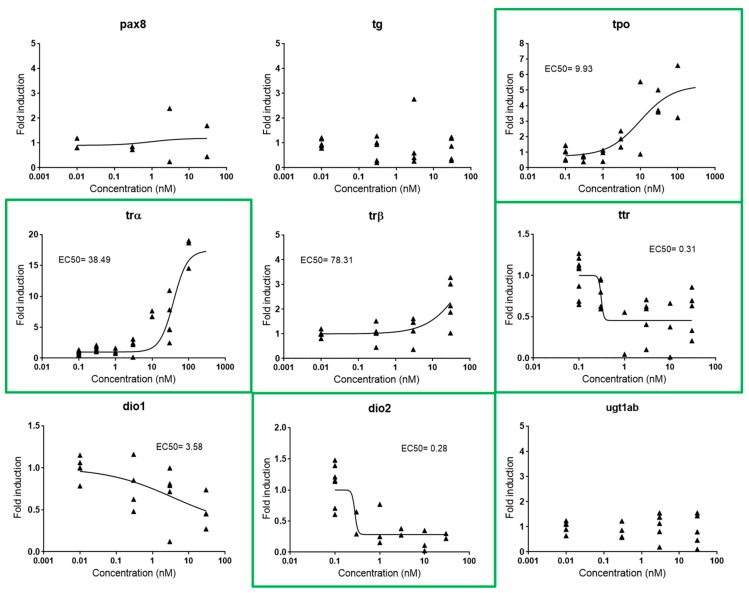
Figure 4.
Dose-response curves for pax8, tg, tpo, trα, trβ, ttr, dio1, dio2, and ugt1ab in zebrafish embryos exposed to T3 from 48–120 hpf. EC50s are shown for all responsive genes. Each data point indicates a biological replicate. Biomarkers outlined in green were the biomarkers selected for further experiments.

