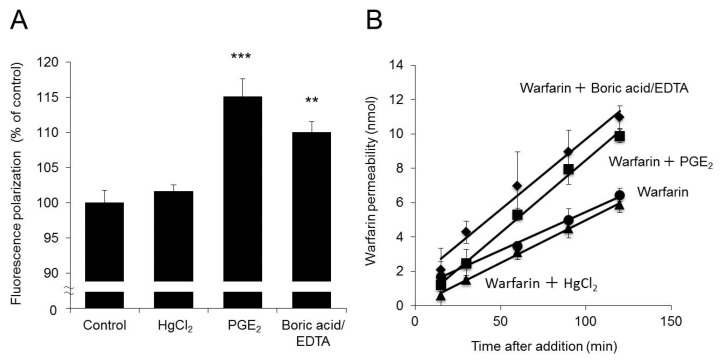
Figure 6.
Effects of increased membrane fluidity on warfarin permeability. Caco-2 cells were plated in Transwell plates and incubated for 21 days. (A) HgCl2, PGE2, or boric acid/EDTA was added to the apical side of the Transwell plate. The fluorescence polarization of 1,6-diphenyl-1,2,5-hexatriene (DPH) was then calculated and expressed as a percentage of the control value, which was set as 100%. (B) Warfarin alone or a combination of warfarin and HgCl2, warfarin and PGE2, or warfarin and boric acid/EDTA was added to the apical side of the Transwell plate. The concentration of warfarin on the basal side was measured. The data are presented as the mean ± SD for six experiments. Dunnett’s test: ** p < 0.01 and *** p < 0.001 vs. the control value.

