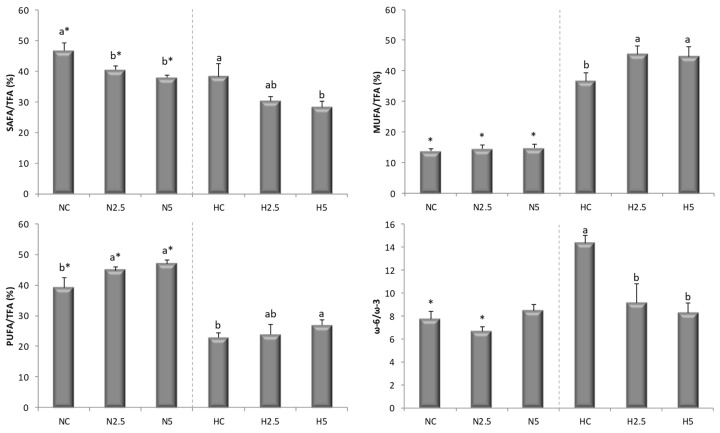
Figure 3.
Saturated fatty acid (SAFA)/total fatty acid (TFA), monounsaturated fatty acid (MUFA)/TFA, polyunsaturated fatty acid (PUFA)/TFA, and ω-6/ω-3 ratios in the liver of rats of the six experimental groups. a,b Different letters show significant statistical differences (p < 0.05) among groups fed the standard diet (NC, N2.5, N5) or the high-fat diet (HC, H2.5, H5) after performing a one-way ANOVA. * Significant statistical difference (p < 0.05), after carrying out a two-sample t test, between the members of the NC-HC, N2.5-H2.5, and N5-H5 pairings. Result are expressed as mean ± SD.

