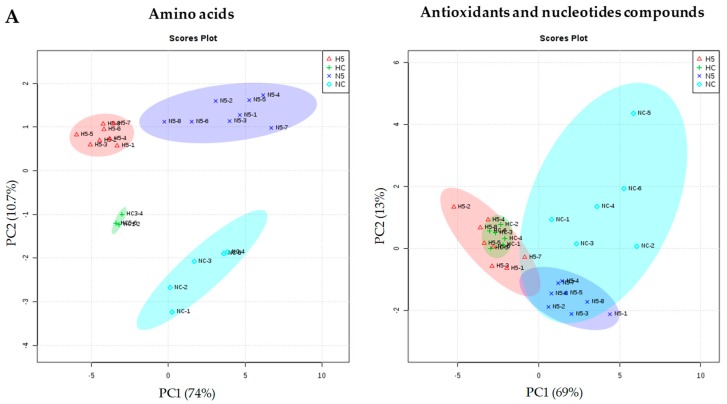
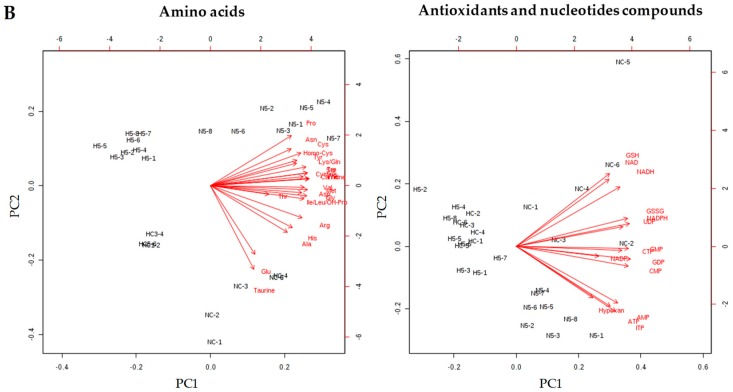
Figure 4.
(A) PCA scores and (B) eigenvector plots for the amino acids, antioxidants, and nucleotides compounds, according to the metabolites found to differ significantly (ANOVA p < 0.05) among the different diets: group NC: standard diet, N5: standard diet + 5% spinach, HC: high fat diet and H5: high fat diet + 5% spinach. Confidence regions are marked with different ellipses.


