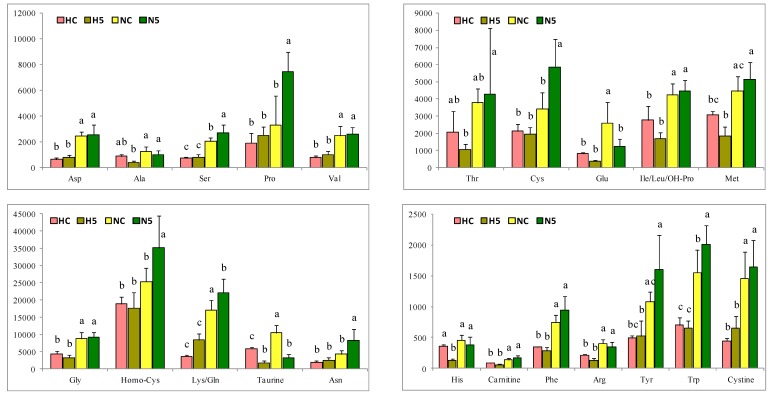
Figure 5.
Amino acid content in the liver of rats of the four experimental groups (HC: high fat diet, H5: high fat diet + 5% spinach, NC: standard diet and N5: standard diet + 5% spinach). The bar height indicates the mean value of each feed condition and the error bar indicates the standard deviation. a–c Different letters indicate significant statistical differences (p < 0.05).

