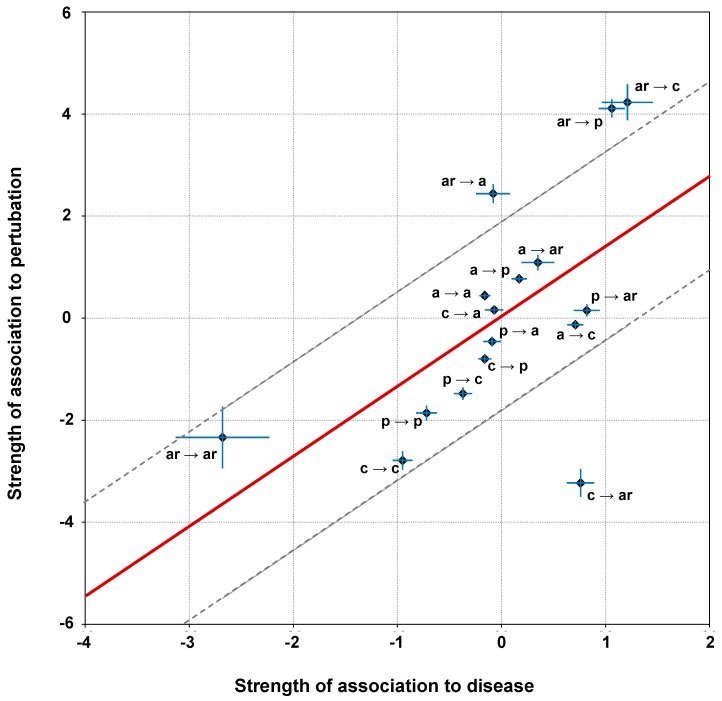
Figure 4.
Correlation among strength of association of SRV types to diseases versus their strength of association to protein stability perturbation. Labels for variation types are as follows: p=polar, ar = aromatic, a = apolar and c = charged. Regression line is computed as described in Section 3.6. Error bars along both axes are computed as detailed in Section 3.5. Pearson’s correlation coefficient is equal 0.59 (p-value equals 0.01).

