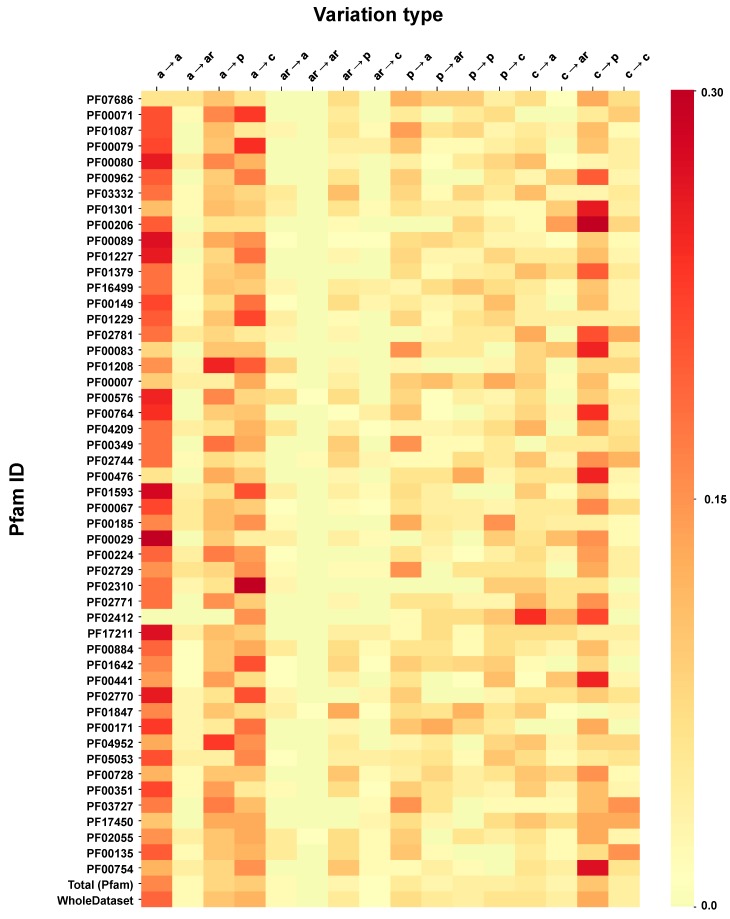
Figure 6.
The heatmap shows the frequency of occurrence of each disease related variation type per Pfam domain. The color span from yellow (low frequency) to red (high frequency). Average and median Kullback–Leibler divergences between individual Pfam distributions and the background (WholeDataset) are 2.5 and 2.1 bits, respectively.

