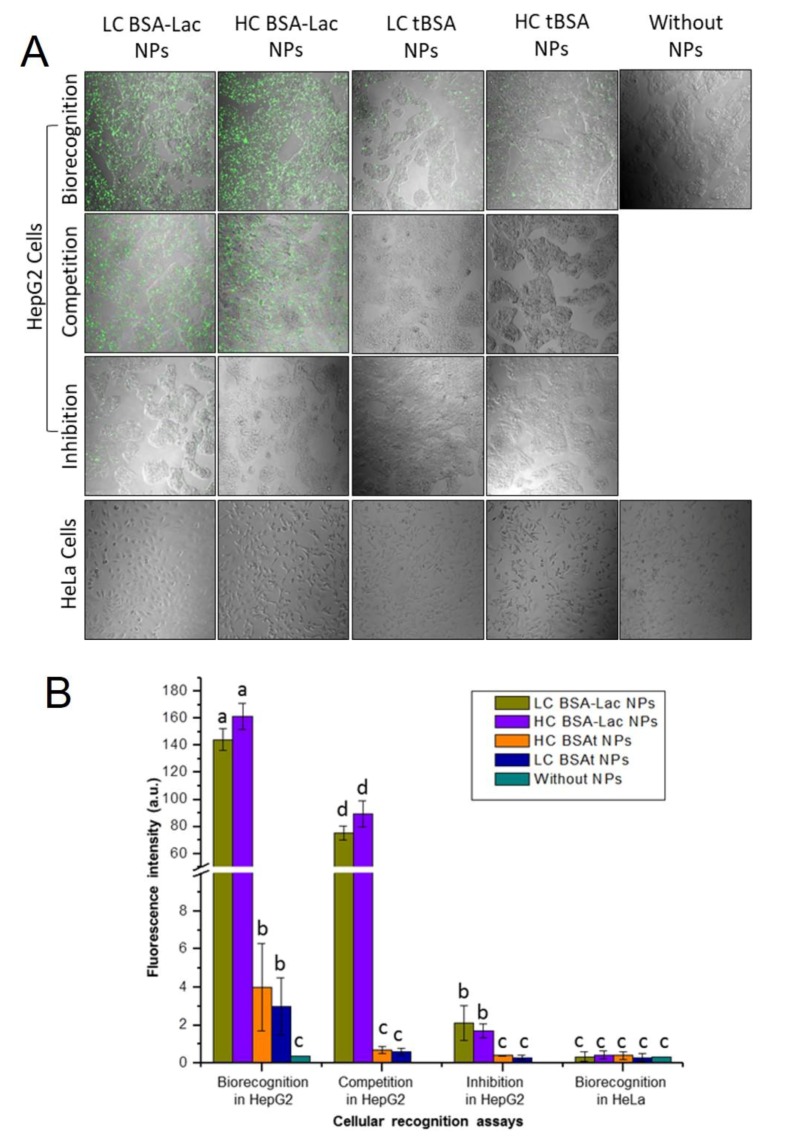
Figure 5.
Evaluation of cellular interaction of NPs in human liver cancer (HepG2) and human cervical carcinoma (HeLa) cells. (A) Confocal fluorescence images of HepG2 and HeLa cells with LC or HC BSA-Lac NPs. NPs were labeled with fluorescein isothiocyanate (FITC). (B) Quantitative analysis of fluorescence intensity of HepG2 and HeLa cells exposed to NPs samples. Experiments were performed in triplicate and analysis by ANOVA followed by Tukey’s test; p ≤ 0.05. Different letter (a, b, c and d) shows statistical significance.

