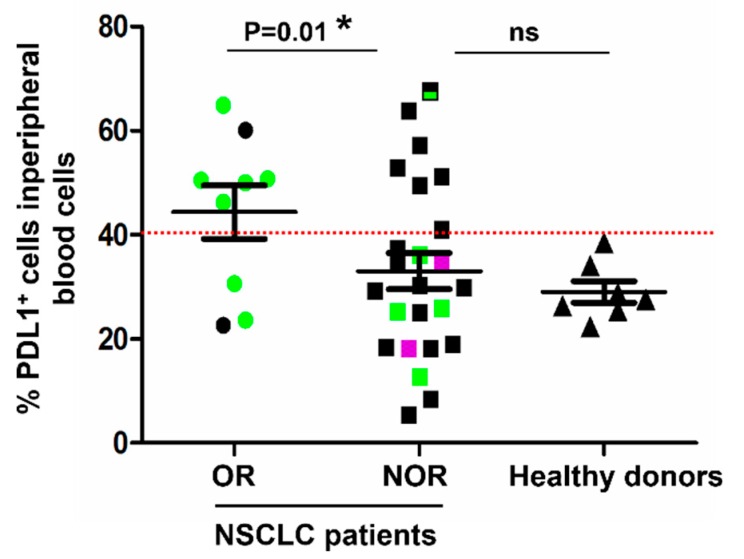
Figure 3.
Quantification of PD-L1+ cell subsets in systemic immune cells and correlation with clinical responses. Dot plot graph representing the percentage of PD-L1+ cells within total systemic immune cells quantified from fresh peripheral blood samples before the start of immunotherapies, in objective responders (OR, N = 9), non-responders (NOR, N = 24), and healthy donors (N = 7). Relevant statistical comparisons are shown within the graph, by the exact test of Fisher. In green, patients with >40% circulating memory CD4 T cells. In purple, patients with stable disease. In black, patients with <40% circulating memory CD4 T cells. The dotted red line indicates the cut-off value used to test the association of the percentage of PD-L1+ T cells with clinical responses.

