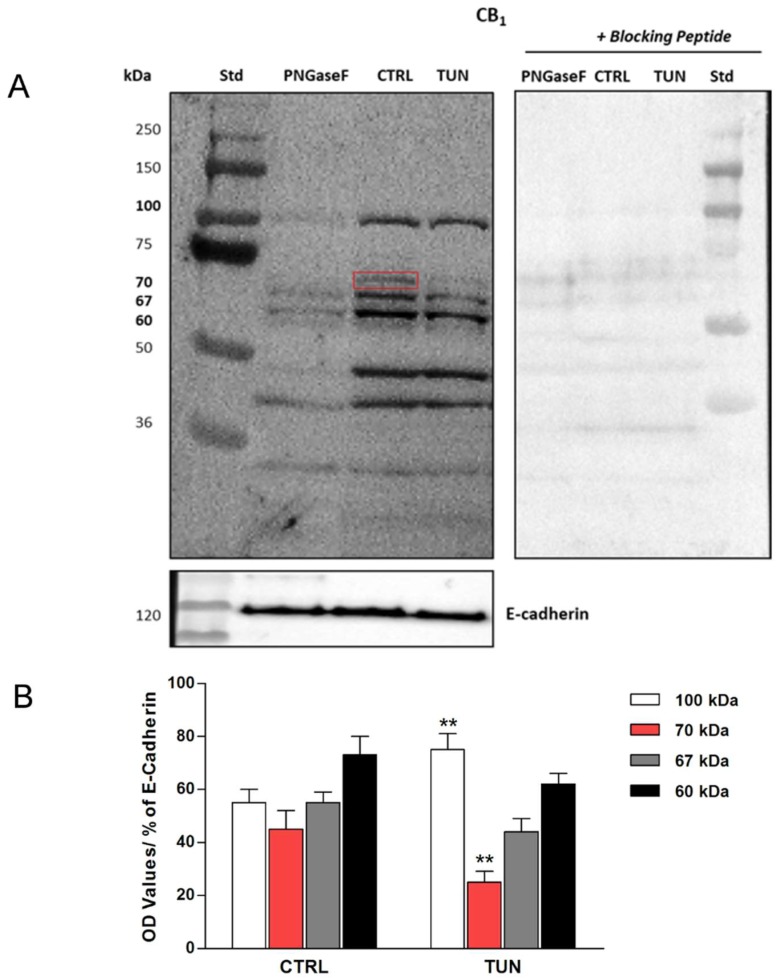
Figure 2.
Representative Western blot of tunicamycin effect on cannabinoid receptor 1 (CB1) protein expression. SH-SY5Y cells were treated for 24 h with tunicamycin (TUN 1 µg/mL) and with PNGase F (20 µL of 500 U/mL solution), as indicated. Controls with specific blocking peptides are also shown. The red square indicates the immunoreactive band at 70 kDa, erased by tunicamycin and PNGase F treatments (A). Densitometric analysis of CB1 immunoreactive bands (100 kDa, 70 kDa, 67 kDa and 60 kDa) normalized to E-cadherin content. Data are presented as means ± SEM (n = 3) [** p < 0.01 vs. CTRL] (B).

