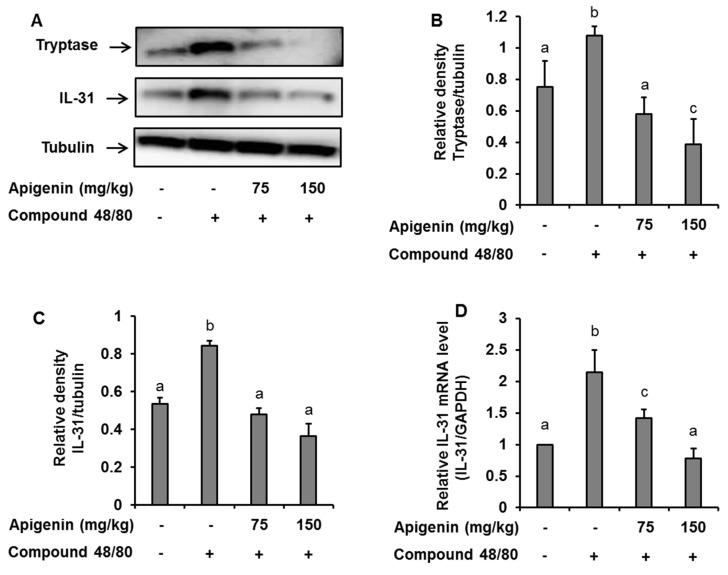
Figure 6.
Western blot and RT-PCR analysis showing the effects of apigenin on compound 48/80-induced tryptase and IL-31 expression in the mice skin. Five mice each were placed into four groups: Compound 48/80 negative control; compound 48/80 positive control; compound 48/80 with apigenin 75 mg/kg treatment; and compound 48/80 with apigenin 150 mg/kg treatment. Compound 48/80 (50 μg/site, 0.1 mL each) was injected in the dorsal dermis of the mice neck 60 min after administration of 2% gelatin or apigenin at indicated concentrations. (A) Western blot analysis of tryptase and IL-31 protein expression. The bands were quantitated using Image J analysis software tool (B,C). (D) RT-PCR showing the expression of IL-31 mRNA in the mice skin. The data presented are the means ± SD of five mice per group. Bars with different small case letters indicated statistically significant difference at p < 0.05.

