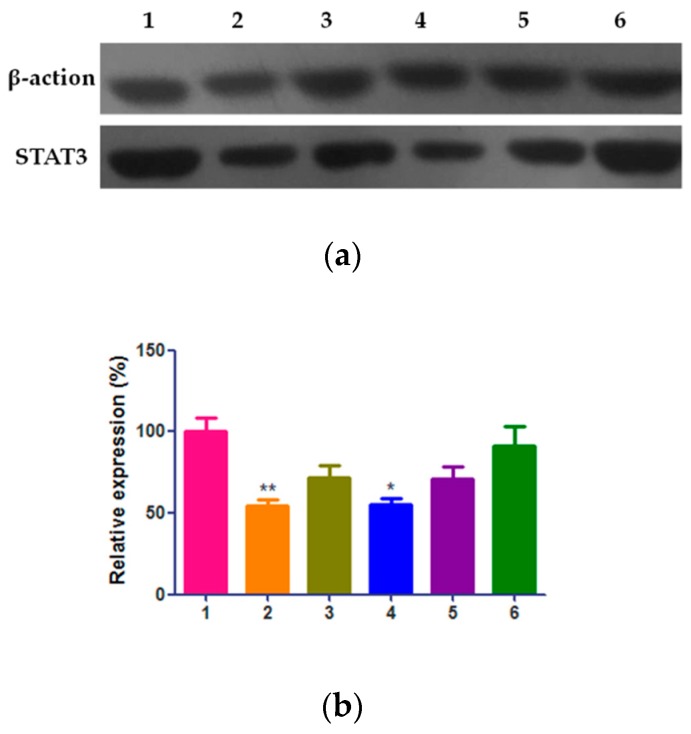
Figure 6.
Effect of QE-NCs with different sizes on the protein level of STAT3 in A549 cells (n = 3). (a) Western blot results. (b) The results of statistical analysis. 1. Blank control group; 2. Cisplatin 3 μg/mL group; 3. QE-NCs (200 nm, 15 μmol/L) group; 4. QE-NCs (200 nm, 30 μmol/L) group; 5. QE-NCs (500 nm, 30 μmol/L) group; 6. QE-NCs (3 μm, 30 μmol/L) group. * p < 0.05, ** p < 0.01, compared with the blank control group.

