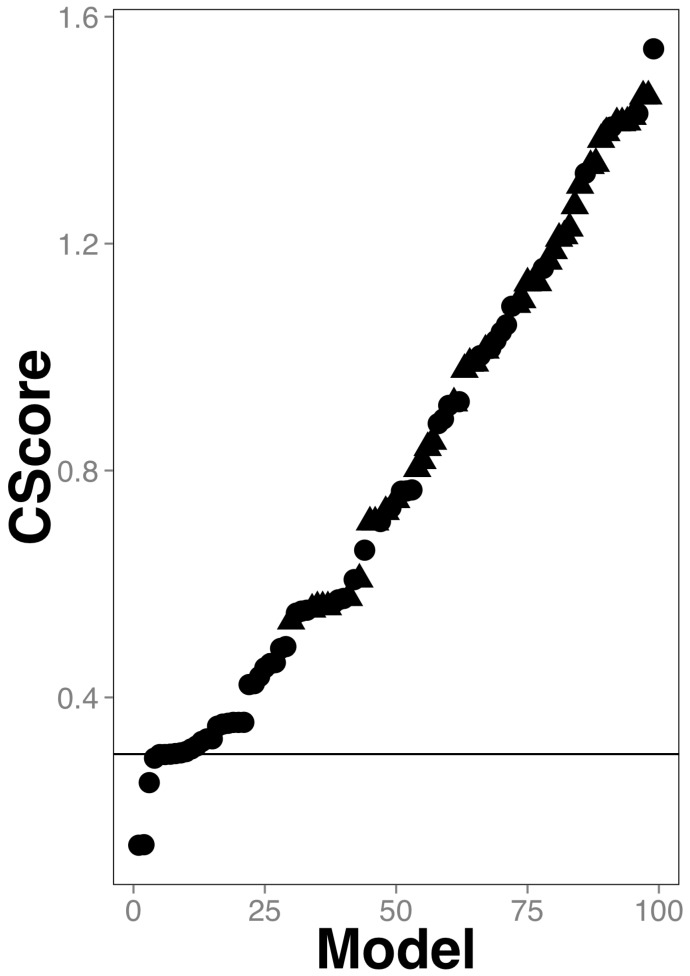
Figure 2.
Classifiers combined scores. A circle represents each model; the best model has the lowest CScore. The line represents the CScore = 0.3, that separates the top 5 models from the rest. The models using heterologous data are represented as circles; triangles are used otherwise. The actual data of this plot can be found in Supplementary Table S20.

