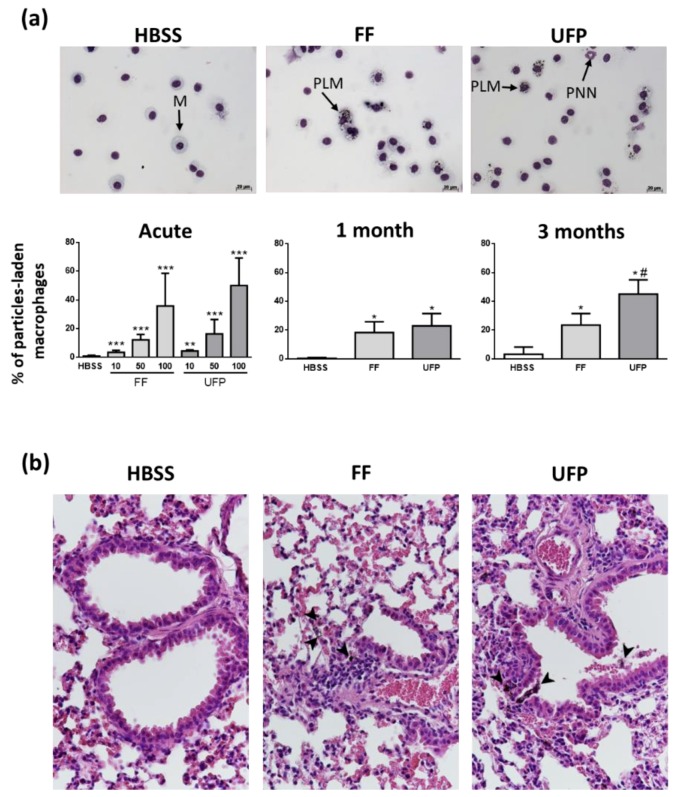
Figure 3.
Internalization of particles in lungs. (a) Representative micrographs of BAL cells of mice exposed for three months and histogram showing BAL cell count of particle-laden macrophages; M = macrophage, PLM = particle-laden macrophage, PNN = Polynuclear Neutrophil. (b) Tissue micrographs of lung tissue (40×); Arrow heads point out particle-laden macrophages. * p ≤ 0.05 vs Control; ** p ≤ 0.01 vs Control; *** p ≤ 0.001 vs Control; # p ≤ 0.05 vs FF.

