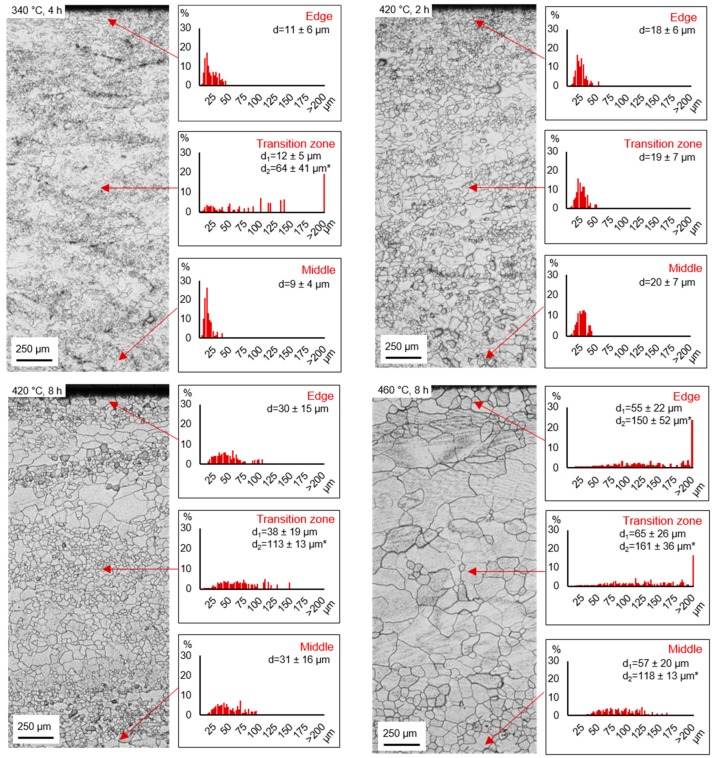
Figure 3.
Microstructures of the annealed ZAX210 alloy with regard to the heat treatment conditions (340 °C, 4 h; 420 °C, 2 h; 420 °C, 8 h and 460 °C, 8 h) and associating grain size distribution depending on the characteristic section of the TRC strip (edge, transition zone and middle); diagrams show grain size class vs. percentage of the grain area in relation to the total area of all measured grains (→ TRC direction, * two maxima due to bimodal grain size distribution).

