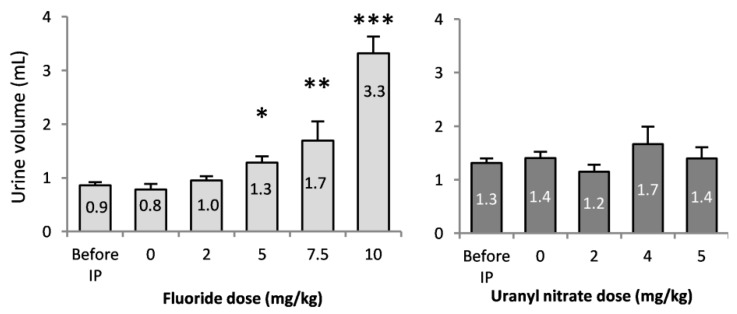
Figure 2.
24-h urine volume collected before and immediately after the intraperitoneal injection of 0, 2, 5, 7.5 and 10 mg/kg F or 0, 2, 4 and 5 mg/kg UN. The results are presented as the mean ± standard error of the mean. The asterisk represents a significant difference between the treated (n = 6 to 12) and control (n = 10) groups (Holm-Sidak test, * p < 0.05, ** p < 0.005, *** p < 0.001).

