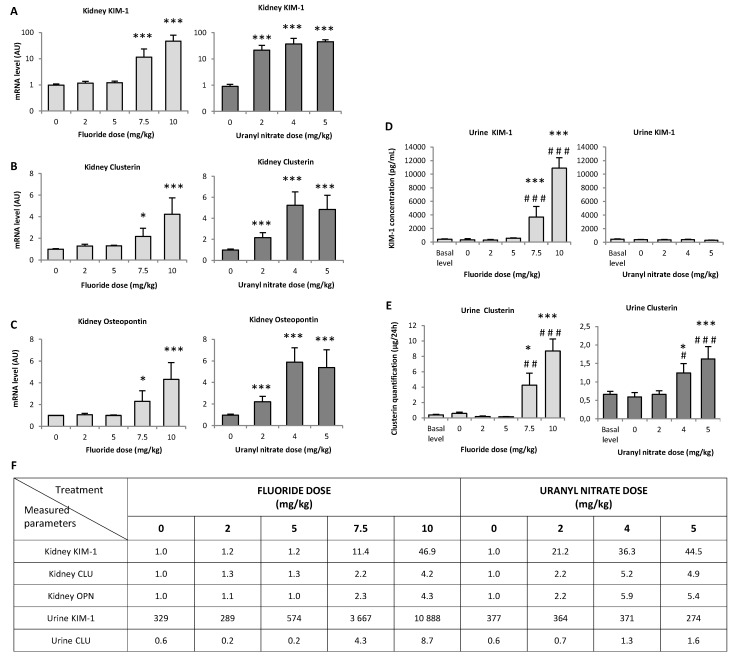
Figure 4.
(A–C) Gene expression of sensitive nephrotoxicity markers in the renal cortex 72 h after the intraperitoneal injection of 0, 2, 5, 7.5 and 10 mg/kg F or 0, 2, 4 and 5 mg/kg UN and (D,E) urinary protein levels of KIM-1 and clusterin in F- or U-injected mice. (F) The measured parameter values are reported in a table with the corresponding units given in each graph. The results of mRNA are expressed as a ratio to the mRNA levels of the housekeeping genes glyceraldehyde 3-phosphate dehydrogenase (GAPDH) and hypoxanthine-guanine phosphoribosyltransferase (HPRT). The results of (A) KIM-1 gene expression are presented on a logarithmic scale. All results are presented as the mean ± standard error of the mean. The asterisk represents a significant difference between the treated (n = 6) and control (n = 5) groups (Holm-Sidak test, * p < 0.05, ** p < 0.005, *** p < 0.001). The sharp symbol represents a significant difference between the treated (n = 6) and preinjected (n = 41 to 47) mice (Holm-Sidak test, # p < 0.05, ## p < 0.005, ### p < 0.001).

