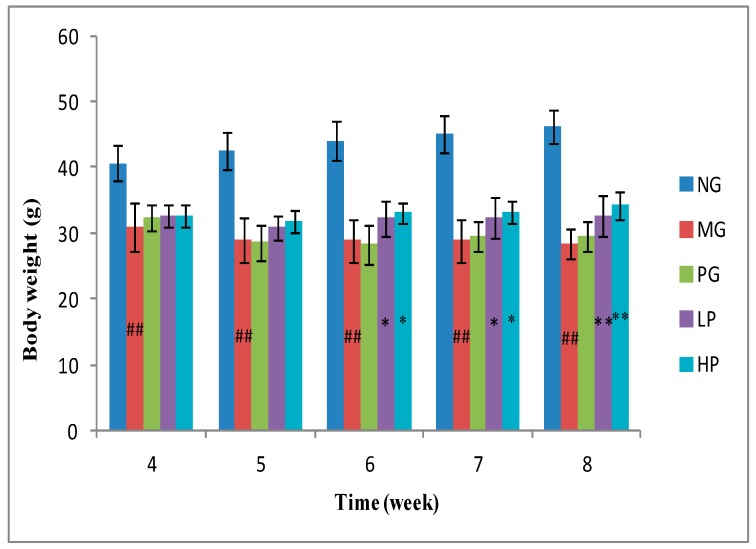
Figure 2.
The body weight of mice in 5 weeks after modeling. NG, normal group; MG, model group; PG, positive group; LP, low-dose polysaccharides group; HP, high-dose polysaccharides group. “##” represents very significant difference compared with NG (p < 0.01); ** represents very significant difference compared with MG (p < 0.01); * represents significant difference compared with MG (p < 0.05).

