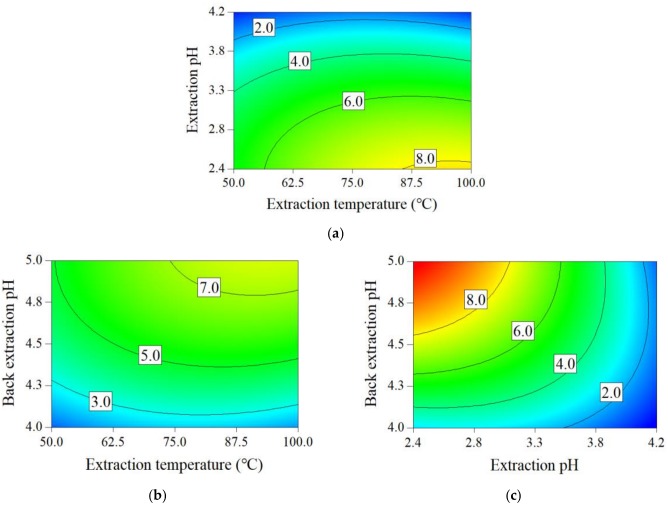
Figure 3.
Contour plots for key process parameter effects on the (a) Extraction pH and extraction temperature effect on the when back-extraction pH = 4.5, (b) back-extraction pH and extraction temperature effect on the when extraction pH = 3.3, (c) back-extraction pH and extraction pH effect on the when extraction temperature = 75.0 °C.

