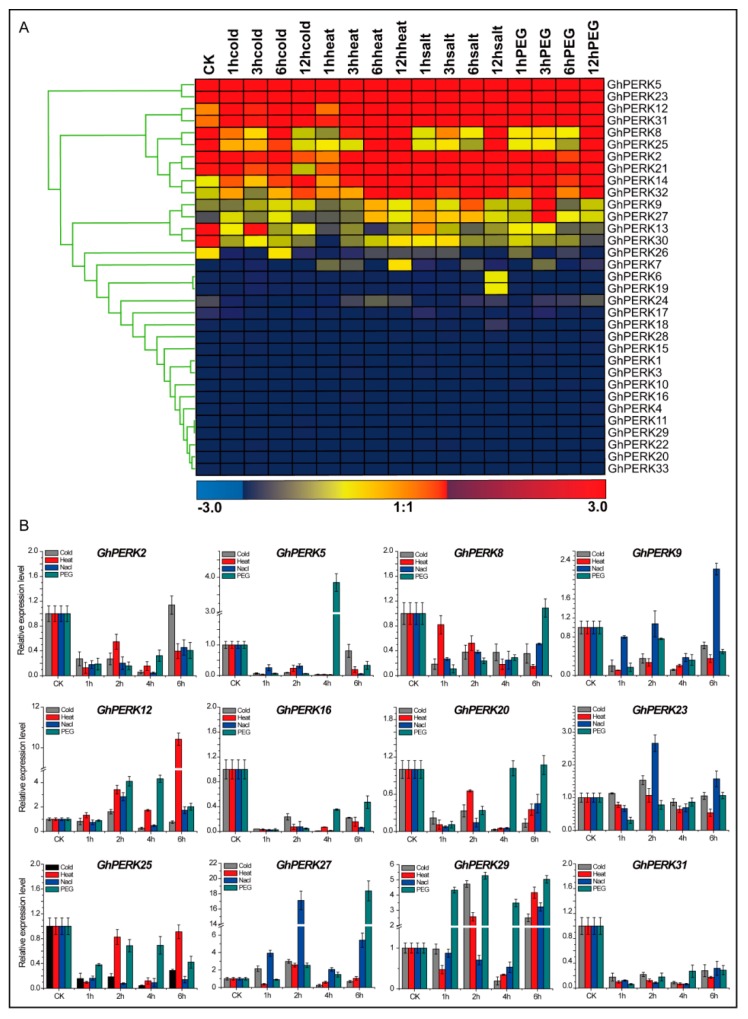
Figure 5.
Expression analysis of GhPERK genes for four different abiotic stresses including cold, heat, NaCl and PEG. (A) Heat map of GhPERK genes constructed by publicly available transcriptomic data. Color bar (down) depicted the level of response for that gene. (B) qRT-PCR expression pattern of GhPERK genes under abiotic stresses. The error bars exhibits standard deviations (SD) among three independent biological repeats.

