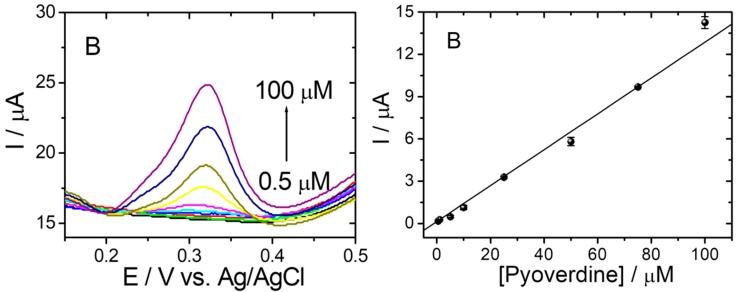
Figure 5.
(A) DPVs in 20 mM PBS pH 7.4 without PyoV (black line) and for different concentrations of PyoV: 0.5 (green line); 0.75 (red line); 1 (dark blue line); 5 (light blue line); 10 (purple line); 25 (yellow line); 50 (olive line); 75 (blue line); and 100 (dark purple line) μM in 20 mM PBS pH 7.4 on graphene/graphite after reduction and AuNPs decoration SPE. (B) Calibration plot of PyoV concentration vs. current (error bars represent the standard deviation for three tests).

