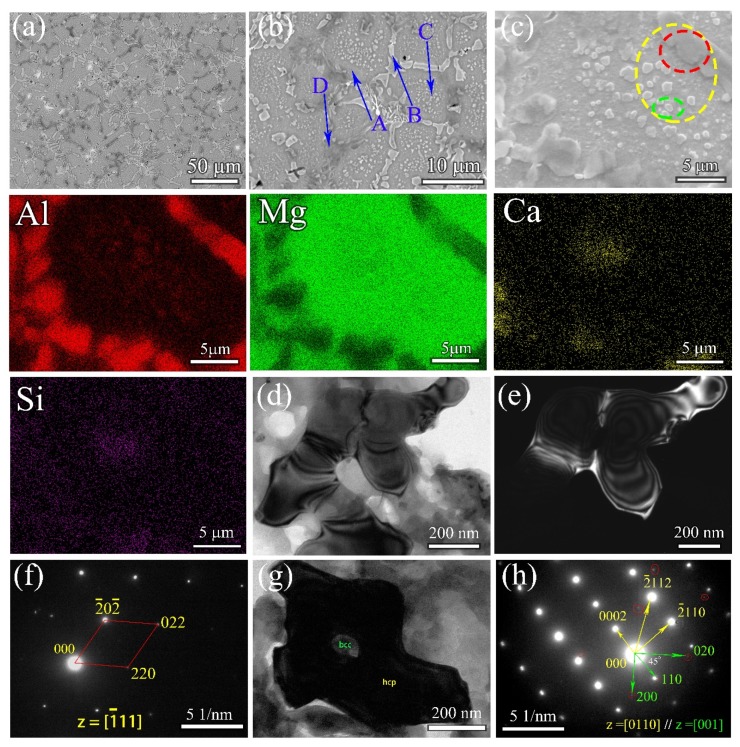
Figure 5.
Microstructures of Al15Li35Mg48Ca1Si1 ULW-CCA. (a–c) are BSE images (from low to high magnification); “Al”, “Mg”, “Ca” and “Si” are the EDS mapping of (c); (d) The bright-field image (BF) of red circled phase in (c); (e) The dark-field (DF) image of the red circled phase in (c); (f) The selected area diffraction pattern of (e). (g) The bright-field (BF) for submicron particle marked by green circle region in (c). (h)The selected area diffraction patterns of dark area in (g).

