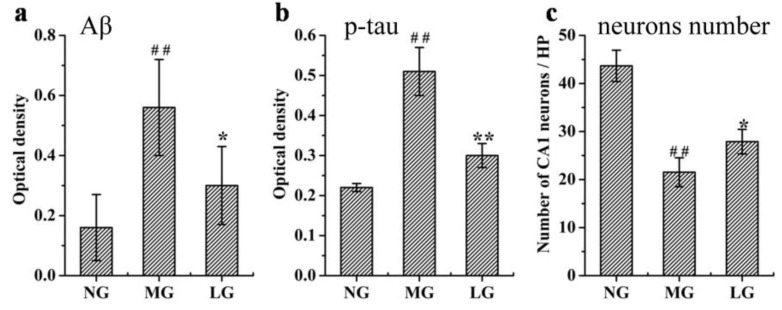
Figure 6.
Effects of lignans from S. chinensis on the protein expression level of Aβ (a) and p-tau (b) and number of neurons (c) in the hippocampus of rats with AD. Notes: n = 10, per group; the data are expressed as mean ± SEM; compared with the normal control group (NG) by a t-test, ## P < 0.01; compared with the AD model group (MG), ** P < 0.01, * P < 0.05.

