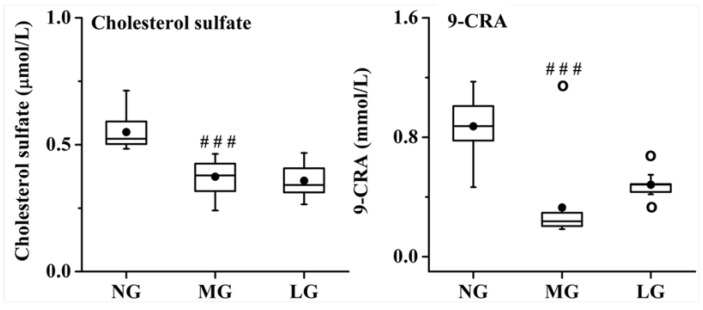
Figure 10.
Effect of lignans from S. chinensis on the level of cholesterol sulfate and 9-cis-retinoic acid (9-CRA) in the plasma of rats with AD. The box limits are in the 25th and 75th percentiles; the median is indicated by the horizontal bar; the whiskers are in the 1.5 interquartile ranges; the horizontal boundaries of the boxes represent the interquartile range and the black solid circle is the mean; data not included between the whiskers are plotted as an empty circle. Notes: n = 10, per group; compared with NG, ### P < 0.001.

