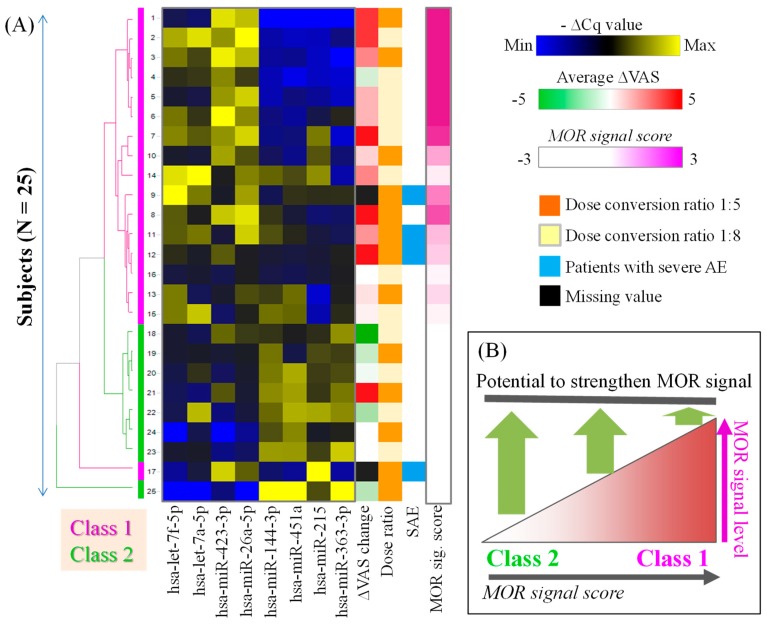
Figure 3.
Circulating miRNA signatures of patients with cancer. (A) The miRNA signatures of patients with cancer before the initiation of hydromorphone treatment (i.e., day 1). The heat map of hierarchically clustered −ΔCq values for MOR-UP and MOR-DOWN miRNAs is presented; yellow and blue represent high and low blood miRNA levels, respectively. The MOR signal score is calculated from the subtraction of the sum of ΔCq for MOR-UP miRNAs from the ΔCq of the MOR-DOWN miRNAs. The patients with high and low MOR signal score values were classified into class 1 and class 2, respectively. The overall trend was that class 1 patients had higher ΔVAS scores than class 2 patients. (B) The putative model for the relationship between the MOR signal score and the potential for hydromorphone to exert analgesic efficacy.

