Figure 1.
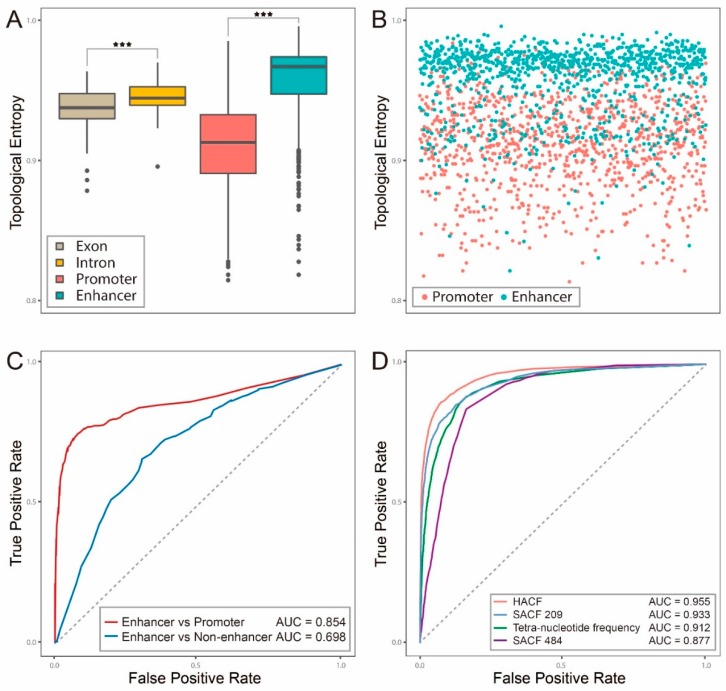
Topological entropies (TEs) of four distinct genomic elements and discriminating enhancer from promoter or non-enhancer with TE. (A).Box-plots of TEs of four distinct genomic elements including intron, exon, promoter and enhancer; *** represents p-value < 0.001; (B)The point-plot of TEs of 200 longest promoters (red) against 200 longest enhancers (green); (C) Two ROC curves of prediction performances of two models with TE: enhancer versus promoter (red) and enhancer versus non-enhancer (blue); The p-value of T test between the AUC of two groups is 1.4 × 10⁻⁷; (D) ROC curves of prediction performances of four feature inputs on the dataset Enhancer4589. HACF: hybrid abelian complexity features; SACF484: the 484 selected abelian complexity features determined by an upper bound estimation; SACF209: the 209 selected abelian complexity features determined by Wilcoxon-test; The p-value of T test between AUC of HACF and SACF209 is 8.1 × 10⁻³; the p-value of T test between AUC of SACF209 and tetra-nucleotide frequency is 2.5 × 10⁻³; the p-value of T test between AUC of tetra-nucleotide frequency and SACF484 is 4.9 × 10⁻⁵.

