Figure 4.
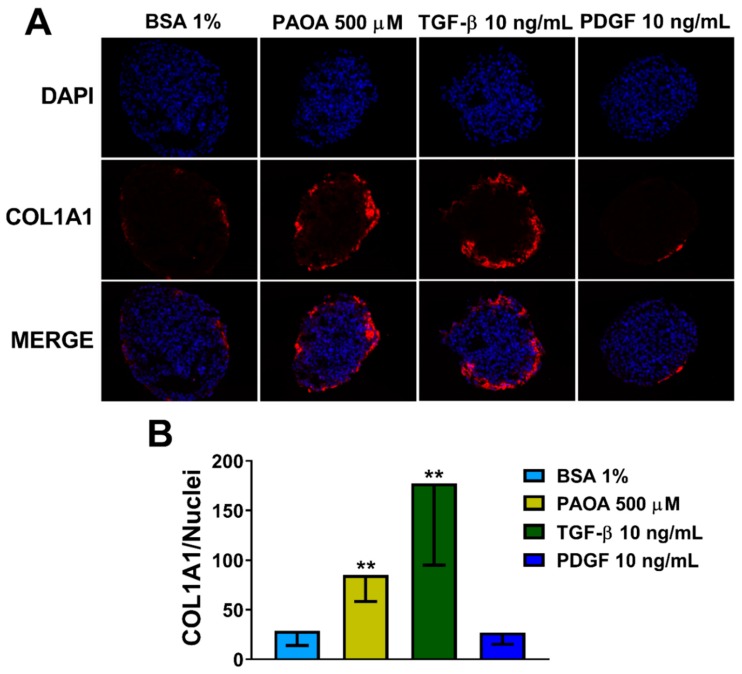
Fatty acid treatment results in an increase in COL1A1 levels in 3D multilineage spheroids. (A) Immunofluorescence staining of DAPI (blue), COL1A1 (red) and merged images of 3D spheroids (HepG2/LX-2, 24:1) treated, after 48 h from the seeding, with BSA 1% (negative control), a mix of palmitic acid and oleic acid 500 μM (1:2), TGF-β 10 ng/mL or PDGF 10 ng/mL for 48 h. All the media for treatments were supplemented with BSA 1%. Objective: 40×. (B) Quantification of COL1A1 levels by ImageJ normalized to number of nuclei. Bars represent mean ± SD (n = 6). P-value was calculated by Mann Whitney non-parametric test, (** p < 0.005 vs. BSA 1%). BSA: bovine serum albumin; PAOA: palmitic acid/oleic acid; TGF-β: Transforming growth factor β; PDGF: Platelet-derived growth factor. COL1A1: collagen type I alpha 1.

