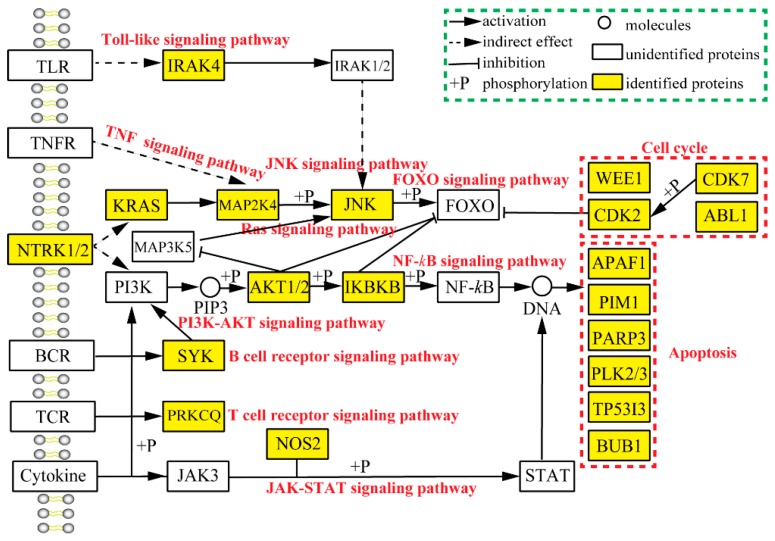
Figure 9.
The schematic diagram of EGCG anti-tumor mechanisms based on reverse docking. The black solid arrows, dashed arrows and T-shaped lines represent the activation, indirect effect and inhibition, respectively. The circles, white rectangles and yellow rectangles represent the small molecules, unidentified proteins and identified proteins based on the result of top 40 target proteins through reverse docking. The red word represent the signaling pathway from KEGG terms.

