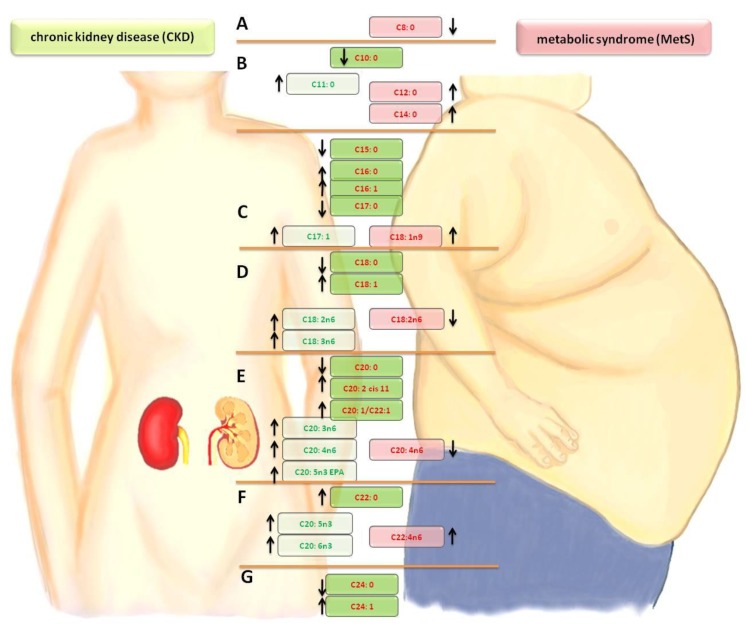
Figure 1.
Comparison of changes in the fatty acid profiles in the CKD and MetS groups. A— lowering short-chain FA. B—saturated fatty acid (SFA) elongation. C—mono-unsaturated fatty acid (MUFA) growth at the expense of SFA/palmitic acid derivatives. D—stearic acid derivatives/synthesis of the n-6 family in CKD. E—cascade of arachidonic acid/synthesis of the n-3 and n-6 families. F—increased synthesis of the n-3 and n-6 families. G—synthesis of nervous acid. Arrow- direction of change (increase or decrease in level fatty acid relative to the control group)

