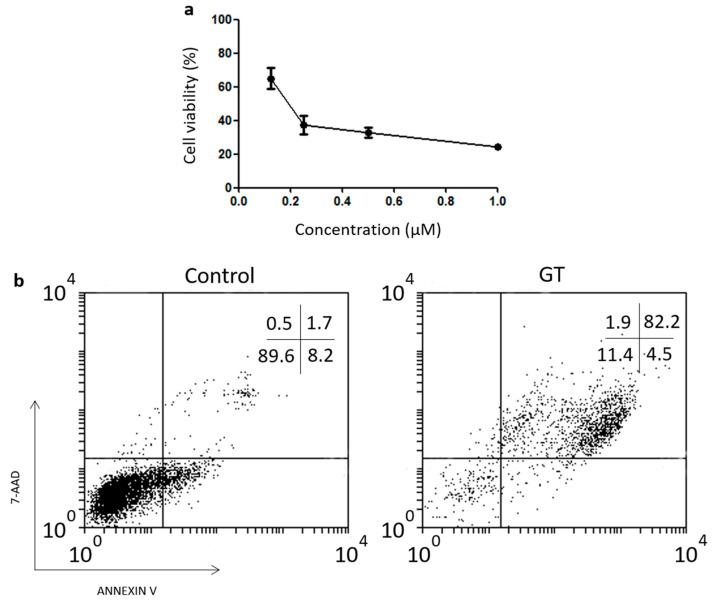
Figure 2.
Effect of exposures to gliotoxin on the viability of L929 cell line. (a) L929 cells were exposed to different concentrations, i.e., 0.06, 0.125, 0.25, 0.5, and 1 µM of GT at 37 °C overnight. Cell viability was measured using MTT assay. The IC50 values indicated in the text were determined by extrapolation, which were presented as mean ± SEM of three independent experiments. (b) A representative dot plot is shown. Cell death was analyzed by FACS monitoring AnnV and 7AAD under the same conditions as before with 0.5 µM of GT.

