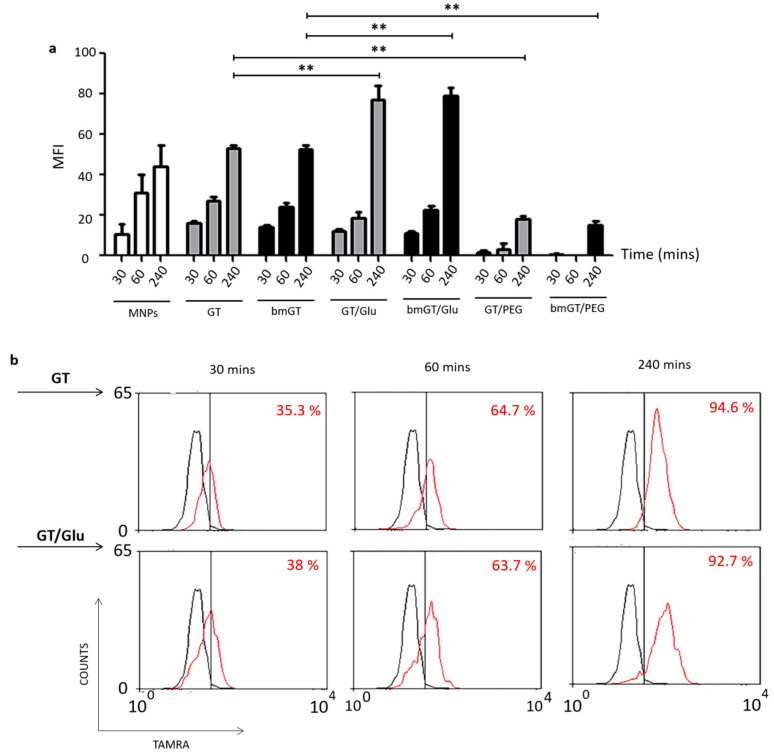
Figure 4.
Uptake kinetics of MNPs. L929 cells were incubated with MNPs or MNPs functionalized with GT/bmGT, GT/bmGT (bismethylthiogliotoxin) and glucose, or GT/bmGT and PEG at a concentration of 10 µM for different incubation times at 37 °C. Subsequently, cells were rinsed 3 times with PBS and fixed in PFA 1%. (a) Mean fluorescence intensity was analyzed by flow cytometry FACS. Graph represents the mean fluorescence intensity of three independent experiments. Statistical analysis was performed using one-way ANOVA with Bonferroni comparing with GT or bmGT as control. **, p < 0.01 (b) Histograms show the mean fluorescence intensity of a representative experiment: untreated cells (black) versus incubated with or without glucose (red). The percentage of cells was determined by flow cytometry.

