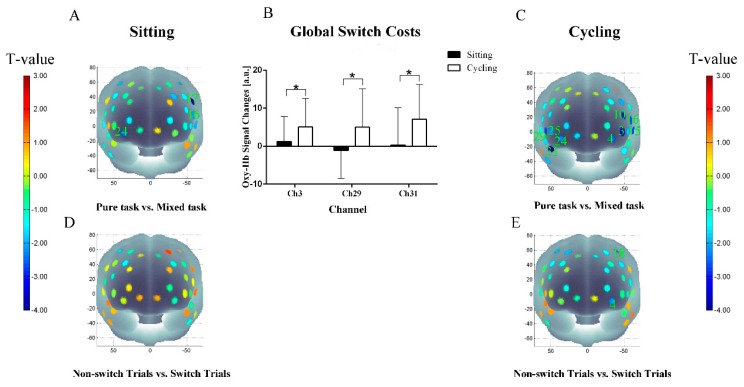
Figure 5.
fNIRS results of task-switching (A) t-map of oxy-Hb concentrations in the sitting condition, pure task vs. mixed task; (B) Oxy-Hb changes related to the global switch costs; (C) t-map of oxy-Hb concentrations in the cycling condition, pure task vs. mixed task; (D) t-map of oxy-Hb concentrations in the sitting condition, non-switch trials vs. switch trials; (E) t-map of oxy-Hb concentrations in the cycling condition, non-switch trials vs. switch trials. Data are expressed as mean ± SD. * indicates FDR-corrected P < 0.05.

