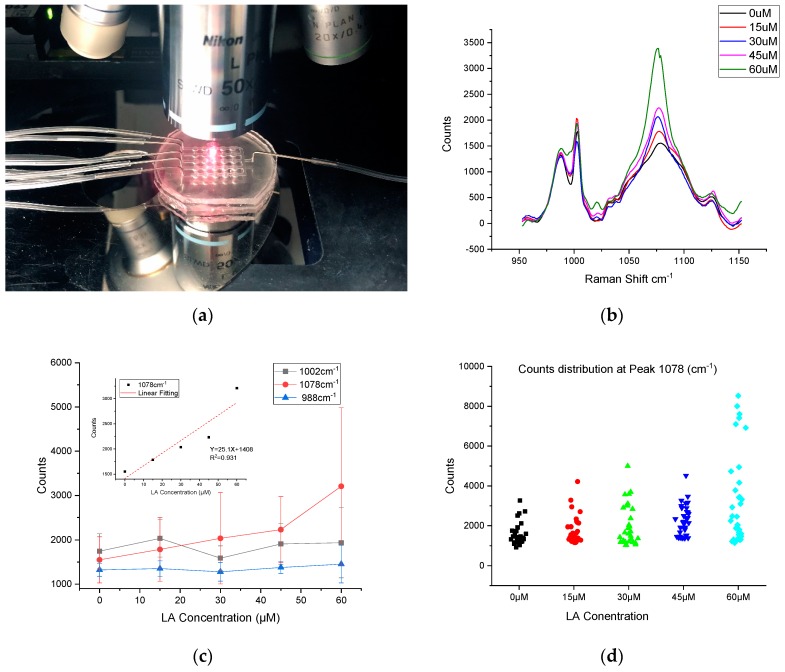
Figure 6.
SERS measurement setup and results (a) SERS measurement of HEK293-GPR120 cells cultured in the microfluidic device. (b) Mean Raman spectra of HEK293-GPR120 cells treated with different concentrations of linoleic acid (n = 30–35). (c) Mean counts and standard deviation of HEK293 cell Raman spectra at peak 988 cm−1, 1002 cm−1, and 1078 cm−1 treated with different LA concentrations. Inset: relationship between SERS intensities at 1078 cm−1 peak and LA treatment concentration. (d) Counts distribution of the samples with different LA treatment concentrations.

