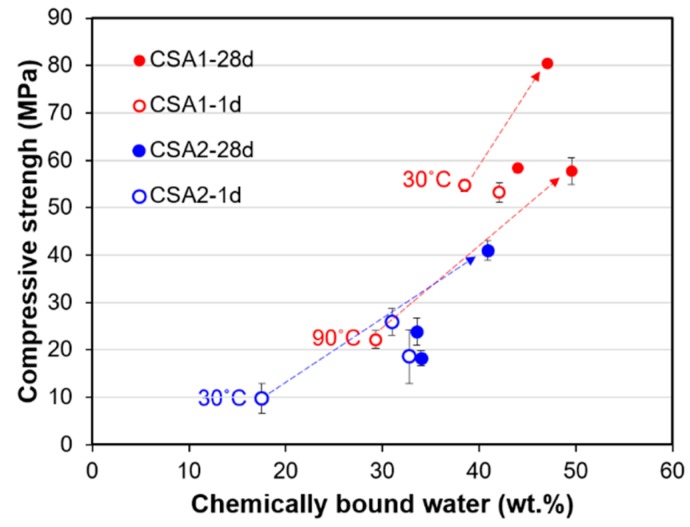
Figure 13.
Inverse relationship between compressive strength measured at 1 day and 28 days and chemically bound water contents obtained by TGA on each samples cured at 1 day and 28 days. Grey arrows indicate the enhancement of strength from 1 day to 28 days and corresponding increase of chemically bound water contents from 1 day to 28 days.

