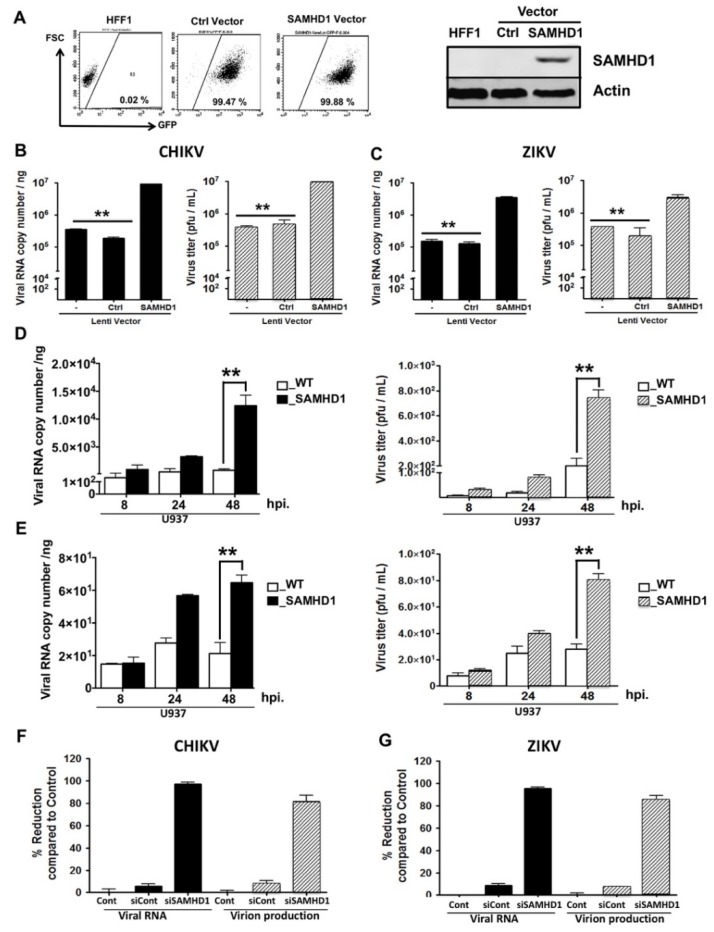
Figure 5.
SAMHD1 over-expression enhances CHIKV and ZIKV replication. (A) HFF1 cells were transduced by either control (Ctrl)- or SAMHD1-GFP lentiviral vector. Transduced cells were sorted by a FACSAria III cytometer and obtained cell lines were validated for GFP expression by flow cytometry (10,000 single cell events in the analysis gate) and for SAMHD1 expression using Western blotting analysis. (B,C) Untreated (−), control transfected (Ctrl) or SAMHD1-(SAMHD1) transfected HFF1 cells were infected with CHIKV or ZIKV at MOI 1. At 48 hpi, intracellular viral RNA was quantified by RT-PCR (black bars); virus titers were measured using a plaque assay (gray bars). (D,E) Wild type U937 cells (WT) or U937 cells expressing SAMHD1, were infected with CHIKV or ZIKV at MOI 1. At 8, 24 and 48 hpi, the intracellular viral RNAs was quantified by RT-PCR (black bars); virus titers were measured by plaque assay (gray bars). (F,G) Amounts of CHIKV and ZIKV RNA and infectious virion production were determined at 24 hpi in HFF1 cells that were mock-transfected (Cont) or transfected, either with control siRNA (siCont) or siRNA specific for SAMHD1 (siSAMHD1). Expression of viral RNA and viral titers were quantified using real time RT-PCR (black bars) or plaque assay (gray bars), respectively. Percentage of reduction was calculated for each of the experimental conditions (siCont and siSAMHD1) using the formula [1 − (R/C)] × 100, where C and R designate experimental values (RNA copy numbers or plaque numbers) in untreated cells and siCont- or siSAMHD1-treated cells, respectively. The data represent the mean values ± SD from three independent experiments. ** p-value < 0.01 as compared to control cells.

