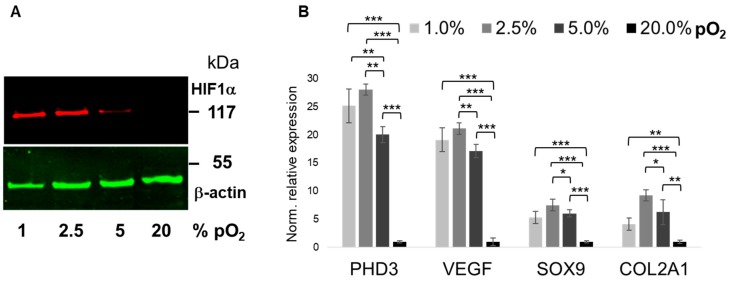
Figure 1.
Validation of hypoxic conditions and its effect on marker gene expression. Figure shows representative HIF-1α protein expression next to that of β-actin as loading control (A). Relative mRNA expression of hypoxia- and chondrocyte-specific markers (B). As expression of all four markers was significantly suppressed under “hypoxic” conditions (≤5% pO2), as compared to “normoxic” conditions (i.e., 21% pO2), we confirmed robust oxygenation levels within the micro-bioreactor. Screening of marker gene expression after 48 h further revealed significant differences in mRNA levels between 1% and 5% of oxygenation and also between 2.5% and 5% pO2. Oxygenation levels are shown as grey scales of increasing intensities from 1% to 21%, respectively. Molecular weight (kDa) is indicated; Western blots (n = 3), RT-qPCR (n = 6); * p < 0.05, ** p < 0.01, *** p < 0.001.

