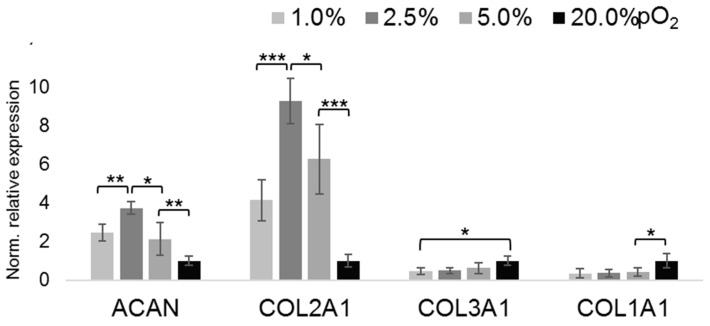
Figure 2.
Oxygen tension-dependent expression of ECM markers. RT-qPCR gene expression analyses of aggrecan core protein (ACAN) and selected types of collagens as phenotypical markers to asses oxygenation level-dependent differentiation. Oxygenation levels (% pO2) appear as grey scales, as shown within the figure. n = 6; * p < 0.05, ** p < 0.01, *** p < 0.001.

