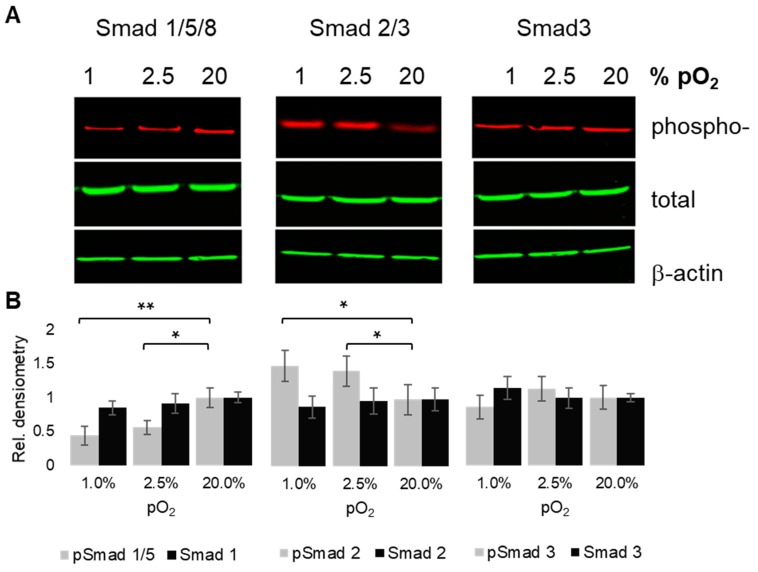
Figure 5.
Oxygen tension-dependent R-SMAD phosphorylation. Chondrocytes were cultured under 1%, 2.5%, and 20% pO2, respectively. Immunoblots showing phosphorylated forms of Receptor SMADs 1/5/8, 2/3, and 3, respectively, next to their respective total expression levels (A); loading control, β-actin. Underneath: Densiometric signal quantification (B); triplicates from three donors; * p < 0.05, ** p < 0.01.

