Figure 5.
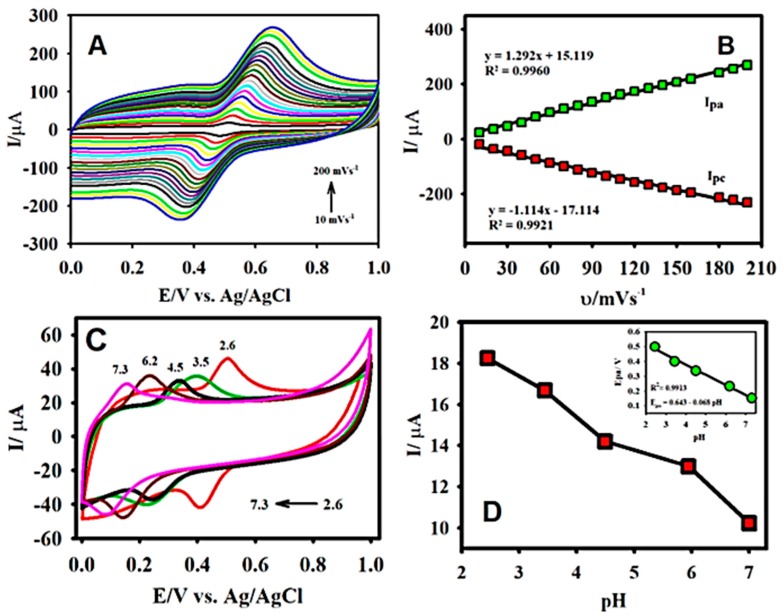
The CV response of F-GO/GCE recorded in the presence of 50 μM CA at different scan rates varying between 10 to 200 mV s−1 (A) and the subsequent plot of anodic/cathodic peak current vs. the scan rate (mV s−1) (B); the CV curves for the oxidation of 30.0 µM CA at different pHs (2.6–7.3) (C); and the resulting plot of anodic peak current vs pH (D) and the corresponding plot of the anodic peak potential vs. pH (insert of D). Electrolyte: 0.1 M B-R buffer solution pH 2.65; scan rate: 50 mV s−1.

