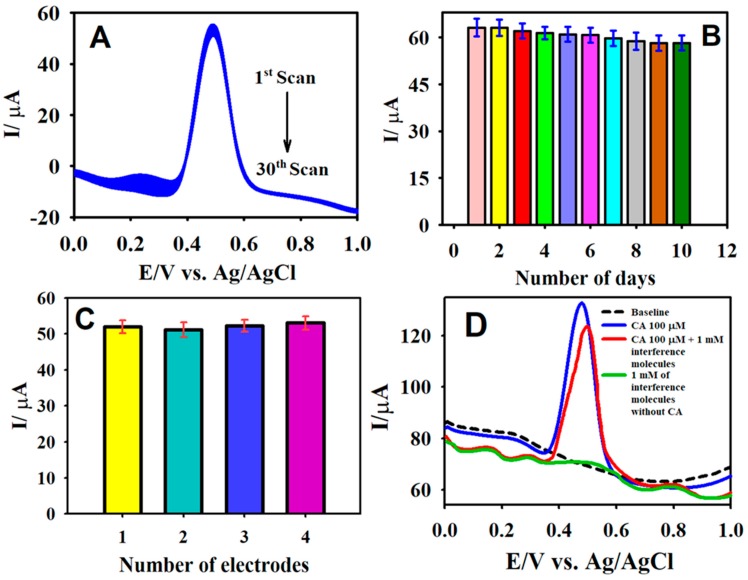
Figure 8.
The DPV curves of the F-GO/GCE recorded in 50.0 µM CA over 30 consecutive measurements (A); the DPV response of F-GO/GCE measured in 50.0 µM CA for 10 days (B); the DPV response recorded in the presence of 50.0 µM CA with four different F-GO/GCEs (C); and the interference response of the F-GO/GCE for the detection of 100.0 µM CA in the presence of 1.0 mM p-coumaric acid, hydroquinone, trans-ferulic acid, gallic acid, glucose, and ascorbic acid (D). Electrolyte: a 0.1 M B-R buffer solution (pH 2.65).

