
Fig. 6.
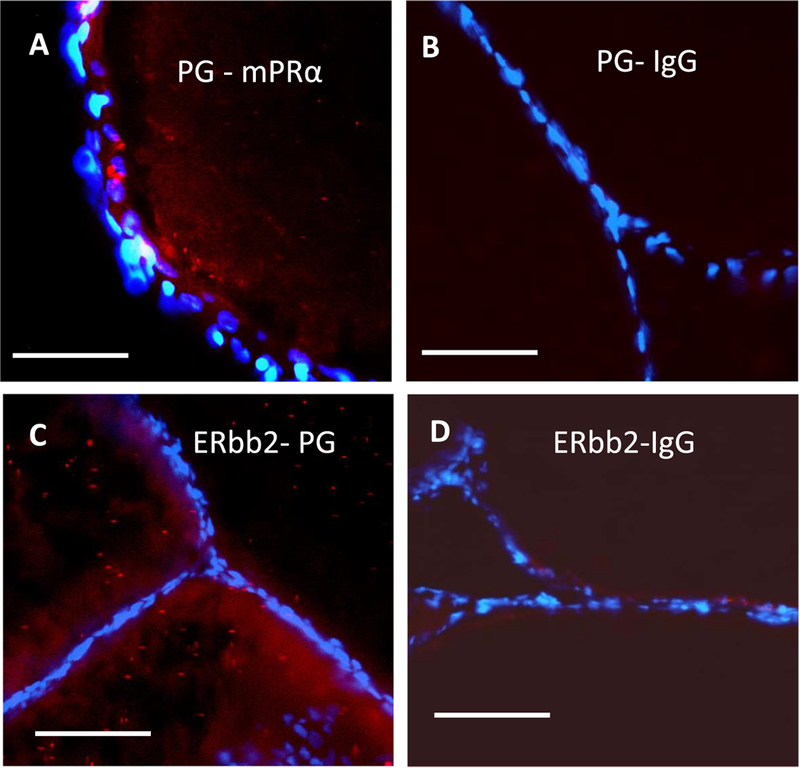
Interactions between Pgrmc1 and mPRα (A, B), and between Pgrmc1 and Erbb2 (C and D) in zebrafish oocytes detected in the in situ proximity ligation assay. Close associations of Pgrmc1 with mPRα are shown as red dots in the image (A). The mPRα antibody was replaced with IgG in the assay as a negative control (B). Close associations of Pgrmc1 with Erbb2 are shown as red dots in the image (C). The Pgrmc1 antibody was replaced with IgG in the assay as a negative control (D). Nuclei of the follicle cells surrounding the oocytes are stained with DAPI (4’, 6-diamidino-2-phenylindole). Scale bars in the images represent 100 μm (μm). The assay was repeated 3 or more times and similar results were obtained on each occasion. (For interpretation of the references to colour in this figure legend, the reader is referred to the web version of this article.)