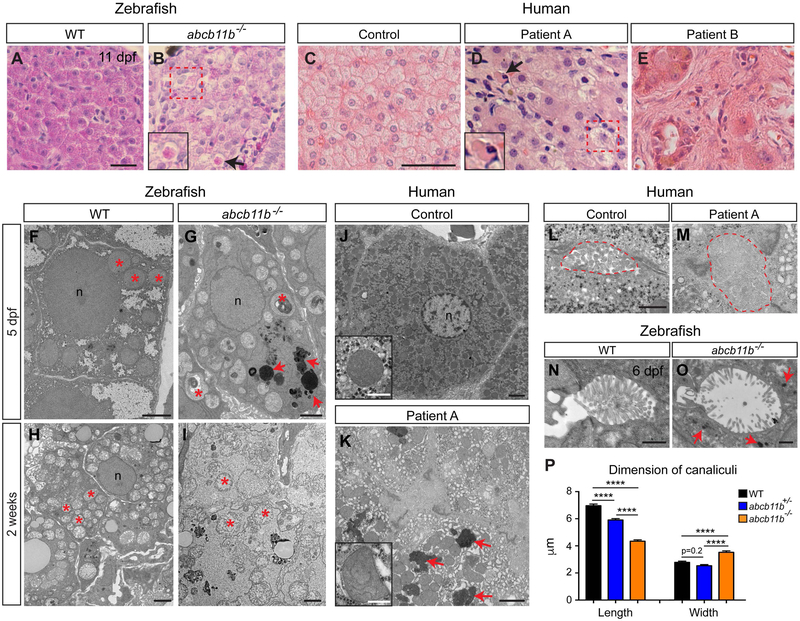
FIG. 3. abcb11b mutant developed hepatocellular injury similar to that observed in patients with PFIC2.
(A,B) H&E staining of the liver sections in WT (n=5) and abcb11b mutants (n=4) at 11 dpf. (C-E) H&E staining of the liver sections from control and two patients with PFIC2. (B,D) arrows point to necrotic hepatocytes with condensed eosinophilic cytoplasm (enlarged in inserts). Dashed red squares label the swollen hepatocytes. (F-I) TEM images of the hepatocytes in WT and abcb11b mutant zebrafish at 5 dpf and 2 weeks of age. 4 WT and 4 mutants were examined at both stages. Red asterisks mark mitochondria. (J,K) TEM images of the hepatocytes in control and patient A. Inserts show mitochondria. Red arrows in (G,K) point to electron-dense amorphous bile-like granular deposits. (F-K) n, nucleus. (L,M) TEM images of the bile canaliculi (marked by dashed lines) in control and patient A. (N,O) TEM images of the bile canaliculi in WT and abcb11b mutant zebrafish at 6 dpf. Red arrows in O point to amorphous bile-like deposits near the bile canaliculus. (P) Length and width (mean±s.e.m.) of the bile canaliculi in 5 dpf zebrafish. Measurements were performed on the confocal three-dimensional projections of 6 WT, 6 heterozygous, and 6 mutant larvae stained with phalloidin to mark the canaliculi. Statistical significance was calculated by one-way ANOVA and Tukey’s post-hoc test. ****, p<0.0001. Scale bars: (A,B) 20 μm; (C-E) 50 μm; (F-K) 2 μm, inserts: 500 nm; (L-O) 1 μm.

