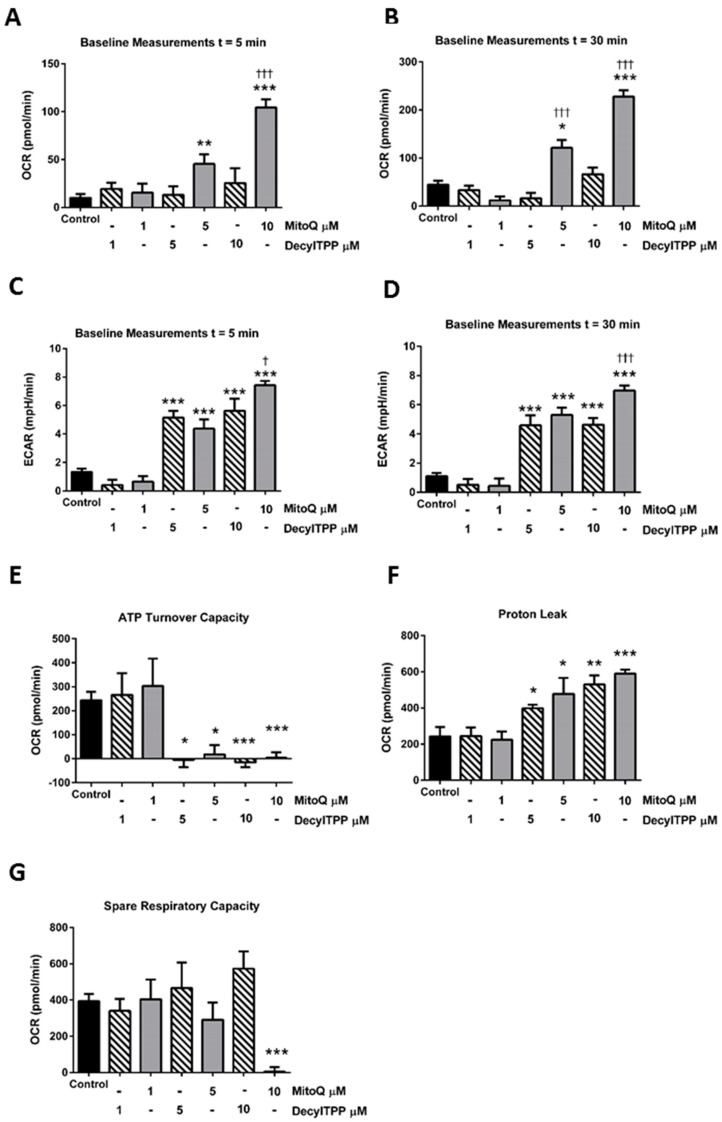
Figure 2.
Effects of MitoQ and DecylTPP on mitochondrial bioenergetics. Bar charts showing the effects of MitoQ (black) and DecylTPP (grey) (1–10 µM) on baseline OCR changes at (A) 5 min and (B) 30 min and baseline extracellular acidification rate (ECAR) changes at (C) 5 min and (D) 30 min and (E) ATP turnover capacity, (F) proton leak and (G) spare respiratory capacity. Data shown as means ± SEM (n = 3). * p < 0.05, ** p < 0.01, *** p < 0.001. † p < 0.05, ††† p < 0.001.

