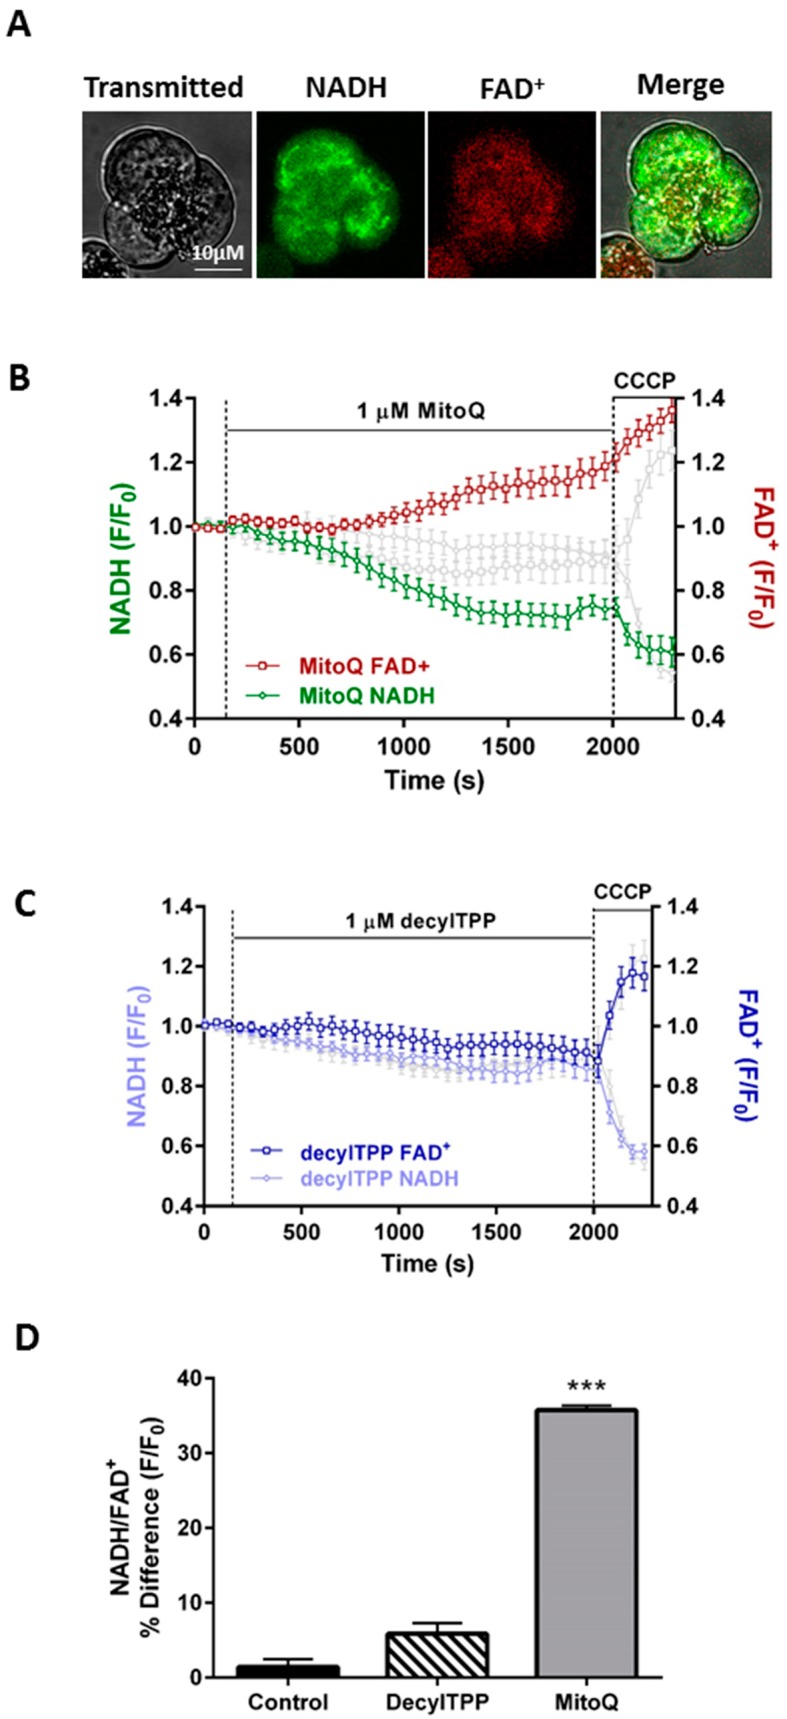
Figure 3.
Effects of MitoQ and DecylTPP on the redox ratio. (A) Typical images showing the transmitted light (left) and mitochondrial localisation of NADH and FAD+ autofluorescence in a triplet of pancreatic acinar cells, measured simultaneously using confocal microscopy. (B) Effects of MitoQ and (C) DecylTPP (1 µM) and CCCP (10 µM) on NADH and FAD+ levels, expressed as normalised values from control (F/F0). Time-matched control recordings are shown in grey. CCCP was applied to show a maximal effect. (D) Effects of MitoQ and DecylTPP (1 µM) on the redox ratio (NADH/FAD+) expressed as a percentage of basal values. Traces are averages of >19 cells from at least 3 animals. All data shown are mean ± SEM. The bar chart is presented as a percentage change from the baseline until the end of treatment. *** p < 0.001 NaHEPES control vs 1μM MitoQ.

