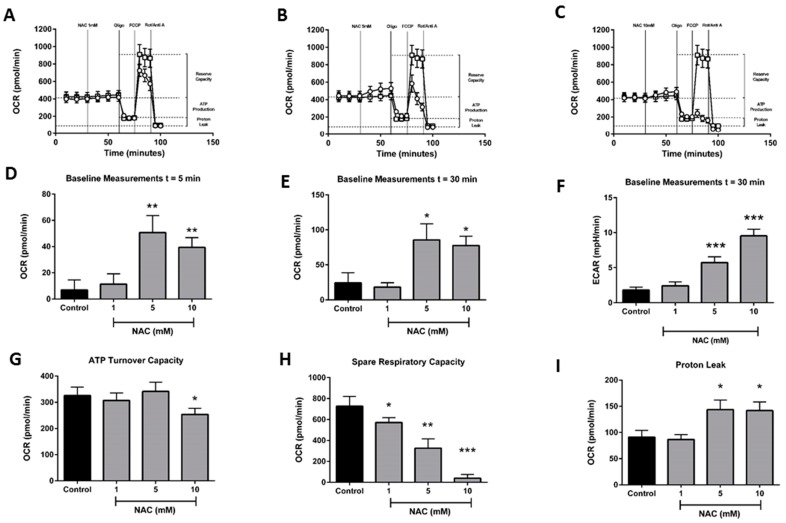
Figure 4.
Effects of N-acetylcysteine on mitochondrial bioenergetics. Plots of respiratory control experiments showing the time-dependent effects of N-acetylcysteine (open circles) (A) 1 mM, (B) 5 mM, and (C) 10 mM on OCR changes compared to control (open squares). A respiratory function ‘stress’ test was carried out using sequential addition of oligomycin (Oligo, 1 μg/mL), FCCP (0.3 μM), and rotenone/antimycinA combined (Rot/AntiA, 1 μM). Bar charts showing the effects of N-acetylcysteine (1–10 mM) on OCR at (D) 5 min, (E) 30 min and ECAR at (F) 30 min, and (G) ATP turnover capacity, (H) proton leak and (I) spare respiratory capacity. Data shown as means ± SEM (n = 3). * p < 0.05, ** p < 0.01, *** p < 0.001.

